I was, for a long time, dreaming of a personalized map of something. Not necessarily a city map, also hiking maps were fine. At home online maps were alwas fine. Zooming in, changing map center and similar stuff went fast, I got all the information I needed. But, eventually, I desired a hard copy of something. Preferably created with an easy-to-use tool.
First try was the export option of OpenStreetMap.org (OSM) – currently my favourite map source. This offers map extract as bitmap images at screen resolution which usually works fine but you’re limited to the pre-rendered tiles and for a large detailed map you would have to stitch it together. They also offer export as vector graphics which is way better, but does not work for larger areas (download often breaks down). And the zoom level is defined by the map size and your screen size, basically.
Second step: ask google, I’m for sure not the first one with this problem. So I tried:
“How to create printable maps from OSM?”
“Export maps OSM print”
“Make my own map with OSM”
Actually, I’m not sure anymore about what I typed. Now these queries help, I was nearly desperate when searching. Most solutions could be summarized to using mapnik – a library which can easily be called from Python. But sometimes I’m even too lazy for Python.
The solution I found is Maperitive and – following the intention of this blog – I, here, write down my personal way of understanding why Maperitive is my solution.
What is Maperitive?
Maperitive a small programm written with Mono – i.e. running easily under different operating systems – for rendering (mainly) OSM maps. It is a successor of some other programm (Kosmos) which was not available for Linux in its most recent version.
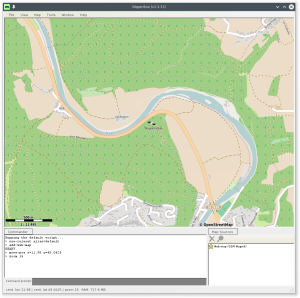
The main windows consists of several areas. The main part is the map itself, it has a menu bar above this. Below the map you have command log and prompt as well as an overview over currently activated maps. At the bottom of the window you see status bar with the current position and zoom level. While you can do a lot with pointing and clicking, the power of this program lies in the command prompt. Let’s go through some examples which emphasize this.
First commands
You can zoom the map by rotating your mouse wheel. For a better control over zoom-level you can just type zoom-in, zoom-out or zoom x where x is the desired zoom level. When doing this you notice the auto-completion of the command prompt which can be toggled by clicking Tools -> Command Prompt Autocomplete.
On the other – just zooming around – using command prompt might not be the best thing for doing that. A lot of simple abbreviations can be found if you type help-keyboard.
Another important “first” command is the move-pos.
For instance
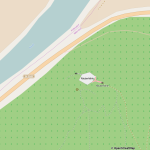
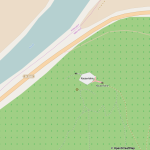
move-pos x=11.98 y=49.0435
followed by
zoom 15
results in the map shown in the screenshot above.
Exporting maps to Bismarck format
Try Tools -> Export To Bitmap and you will find a nice picture of your current map in the output folder below your Maperitive installation directory:
Now, let’s choose a smaller region to understand more features of the export functionality. I first do:
zoom 18

set-print-bounds-view

zoom 15
This, eventually, results in a small rectable in the central region of the map which symbolizes the area which is going to be exported to the Bitmap file. Actually, the second command set the export boundary to the region currently visible on screen. Now I export a bitmap using the command prompt. Four different commands and the resulting output shall be shown here. The commands are:
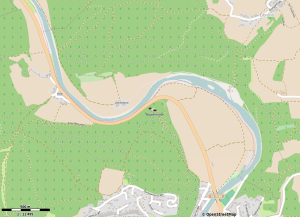
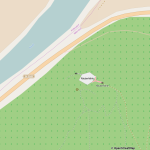
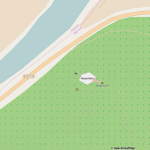
export-bitmap zoom 18 scale=1
export-bitmap zoom 18 scale=2
export-bitmap zoom 18 dpi=100
export-bitmap zoom 18 dpi=200
Click on the figures to enlarge them. The difference is not obvious from the thumbnails. scale and dpi cannot be used simultaneously, their effect is basically the same: they scale the output file. The default resolution is 100dpi. Explicitely setting the resolution changes it, the same is achieved by scaling the image. At this point I was wondering how setting the dpi without defining the image size would be accomplished. The underlying idea is that the image size should be kept as you see it on the screen. As if you put a piece of paper in front of your screen – is that clear? BTW: You can set your screen pixel density with
set-setting display.ppi=94.34 where I put my value which I found on https://www.sven.de/dpi/.
At this point I could end this post. I showed how to define the printing are (set-print-bounds-view) und how to create an output file with the command prompt. There is more and I want to add a few details. Basically I learned an important additional fact about map sources which will be revealed soon.
You got to know one export mechanism. We should also look into exporting to vector graphics
Exporting to vector graphics
You find this additional export mechanism in the tools menu. Similar to export-bitmap we have a lot command prompt options. A good start is export-svg zoom=18 which results in the image behind this link.
Note that this implicitly uses the compatibility=inkscape flag, if you will use Adobe Illustrator alter the command by adding compatibility=illustrator.
Due to scalability vector graphics should be preferred for creating printable things like maps. This is the point where I realized my lack of understanding. The created maps were – except for the scale bar and the copyright notification – stitched together from bitmaps. Sounds stupid but this is how the OSM API works – you send a request and you receive bitmaps. Same holds for the other web maps found in the Tools menu. Meanwhile, this makes sense to me – OSM data can be quite exhaustive. In that way the traffic is better controllable.
Offline maps
To keep traffic further down it is even better to download offline maps, e.g. from http://download.geofabrik.de/. They can be loaded through the command prompt or – in that case even easier – File -> Open Map Sources.
My goal was to create a city map of Hannover to be printed on an A0-poster. To this end I downloaded Europe->Germany->Niedersachsen from the geofabrik link above and extracted Hannover using osmosis (a Linux command line tool):
 bzcat niedersachsen-latest.osm.bz2 | osmosis --read-xml enableDateParsing=no file=- \

--bounding-box top=52.4000632100322 left=9.69266908229375 bottom=52.3482088547386 \

right=9.81424969054236 --write-xml file=- | bzip2 > hannover.osm.bz2
Loading it into Maperitive and deactivating all other map sources (ths can be done in the part of the GUI right to the command prompt) I ended with pure offline maps rendered locally at any desired resolution. Export to SVG was not successful. I think the font-size has to be set to something very large if you want to be able to read it on an A0 poster. Strangely it directly worked for bitmap export:
set-paper type=A0

set-print-bounds-paper map-scale=7000
These command tell Maperitive that I will print on A0 and that the printing bounds follow the paper size. The map-scale is chosen in a way that an A0 paper holds Hannover’s city center. The corresponding bitmap is created by typing
export-bitmap zoom=16 dpi=300
A city map needs a sufficiently high zoom level so you can see also smaller streets and, of course, the resolution should be large enough that you don’t see pixels – where experience told me, 300 dpi would be enough.
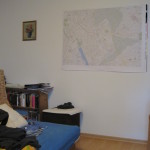
The result is placed in my room now:
Next steps:
- Rendering Rules: How to change them, how to import prefabricated rendering rules into Maperitive – here I chose the one shipped with Maperitive mimicking Google Maps.
- Adding marks: The marks I placed on the map in the photo were drawn by hand – this is acceptable now for me, but not what I desire.
The next maps I want to create are hiking maps and treasure maps in a cool style. I hopefully will soon be able to do so.
Alternatives
Look at the links found in wiki.openstreetmap.org/wiki/OSM_on_Paper. It’s pretty cool what I haven’t found earlier…
